Monitoring with Grafana
Gain confidence in your data pipeline by integrating with monitoring and alerting from your vendor of choice!
With more than 45 vendors to choose from, OpenTelemetry is a natural choice for secure, performant, and flexible observability.
Datavolo Runtimes provide the OpenTelemetry Reporting Task that allows you to send all of your Flow's metrics to any OTLP-compatible endpoint.
Follow this guide to monitor your Datavolo Runtime with Grafana Cloud.
Overview
Through this guide, we'll complete the following steps:
- Register for a Grafana Cloud account
- Authorize your Datavolo Runtime with an Access Token for OTLP
- Configure your Datavolo Runtime to send metrics to Grafana Cloud
- Visualize your Datavolo Runtime metrics with a Grafana dashboard
- Alert for common data pipeline scenarios, like files stuck in connections
This generally follows the steps at https://grafana.com/docs/grafana-cloud/send-data/otlp/send-data-otlp/, then completes the integration by configuring a Datavolo Runtime to send those OTLP metrics.
Grafana Cloud Account
Grafana Cloud supports free, pay-as-you-go, and enterprise accounts. All account types support the same OTLP ingest.
Visit https://grafana.com for more information on how to register for a new account or sign in to an existing account.
Configure an OpenTelemetry Receiver
From the overview page of your Grafana Cloud account:
- Click the
Configurebutton under theOpenTelemetryconnector
- Copy the OTLP Endpoint and numeric Instance ID to use later in your Datavolo Runtime
- Click the
Generate nowlink underPassword / API Token - Enter any Token name, such as
datavolo_runtime, then create the token - Copy the value of the generated token to use later in your Datavolo Runtime

Configure Datavolo Runtime
Datavolo Runtimes support Reporting Tasks that allow you to send metrics and other events to various external systems.
Datavolo's OpenTelemetryReportingTask sends OTLP-compatible metrics through a variety of authentication mechanisms.
-
Login to your Datavolo Runtime
-
Create an instance of the reporting task using the top-right menu > Controller Settings > Reporting Tasks

-
Switch to the
Reporting Taskstab -
Click the
+button to create a new instance of the OpenTelemetryReportingTask
-
Select the
OpenTelemetryReportingTask -
Click the
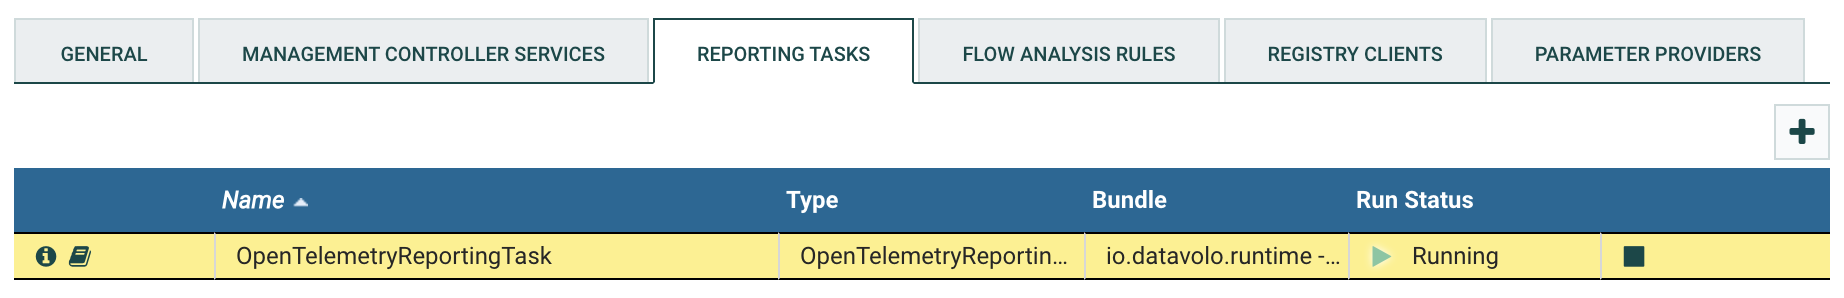
Addbutton- The Reporting Task will initially show as Invalid:

- The Reporting Task will initially show as Invalid:
-
Click the right-hand pencil icon to edit the properties of the Reporting Task.
-
For each property, enter:
- Export Endpoint
- The endpoint from the Grafana OTLP Configuration with
/v1/metricsappended to the end - For example,
https://otlp-gateway-prod-us-east-0.grafana.net/otlp/v1/metrics
- The endpoint from the Grafana OTLP Configuration with
- Export Protocol
HTTP
- Authentication Type
Basic Authentication
- Basic Authentication Username
- The Instance ID from the Grafana OTLP Configuration
- Basic Authentication Password
- The API Token that was generated in the Grafana OTLP Configuration
- Resource Attributes
- Any set of key=value pairs that can identify your instance.
- For example,
service.name=datavolo,environment=production

By default, the OpenTelemetryReportingTask will export metrics every 10 seconds. This may be too aggressive for some use cases. You can change that through the Settings tab with the
Run Schedulefield.
- Export Endpoint
-
When you're ready, click
Applyin the bottom-right of the modal to save all of these changes. -
Start the Reporting Task using the play button on the right-hand side
Congratulations! Your Flow metrics are now being published to Grafana Cloud.
Visualizing Flow Metrics
Getting started quickly? Import the Datavolo Runtime Overview dashboard (ID: 21172) and add your Prometheus data source created from the OpenTelemetry Configuration.
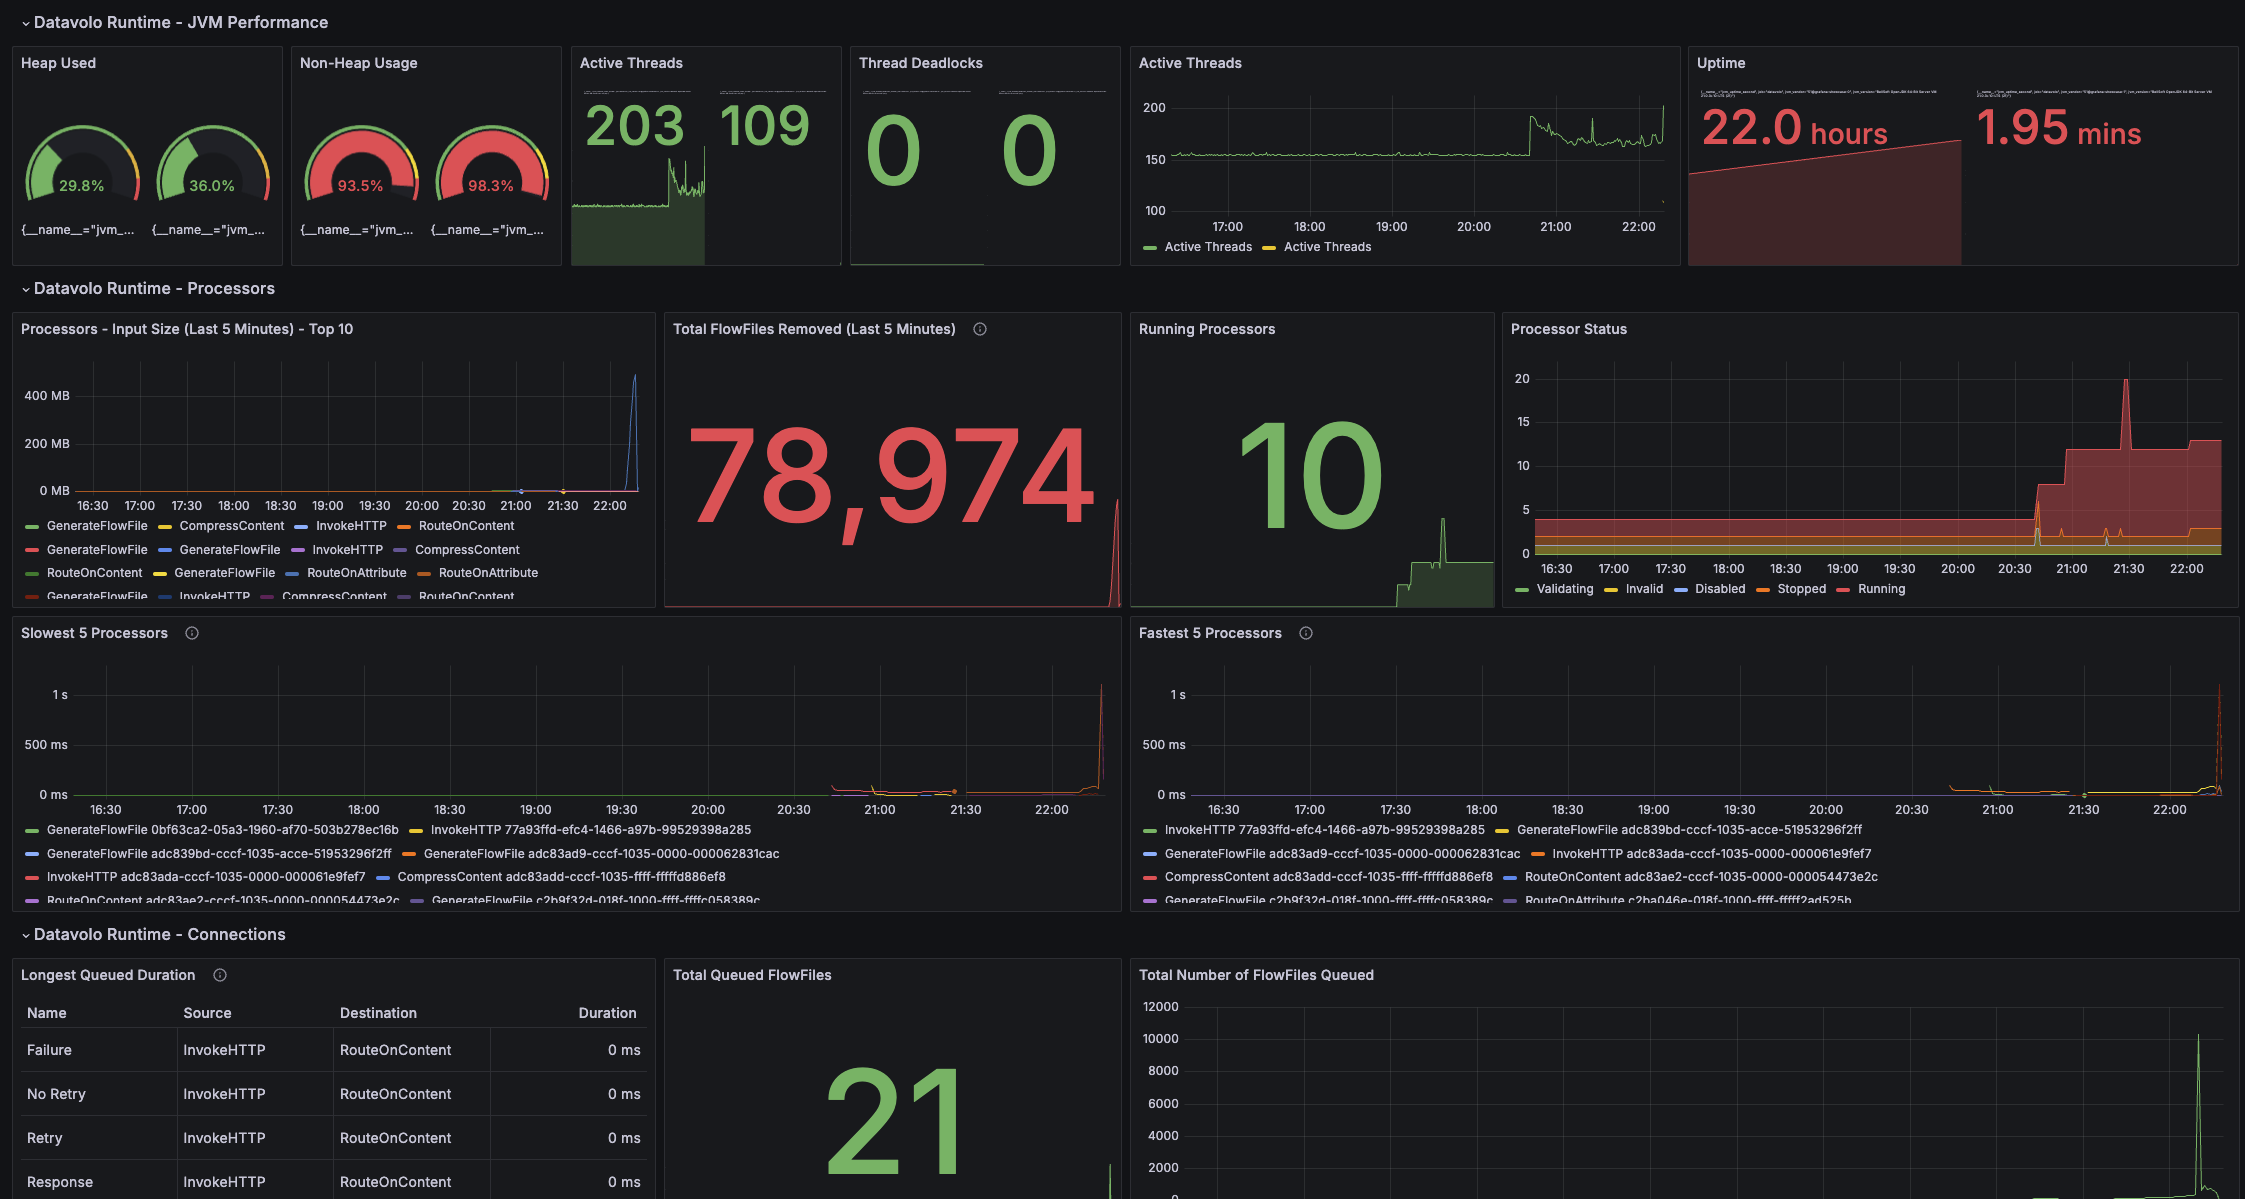
Need more? You can build your own Grafana dashboard with all of the metrics available from this Reporting Task.
Alerting on Flow Metrics
Grafana provides many ways to alert on metrics from your Datavolo Runtime.
One example is alerting whenever a FlowFile has been queued for longer than some period of time (e.g., 1 minute).
To receive a notification from Grafana whenever this happens:
- Navigate to the Alerts & IRM > Alerting > Alert Rules section

- Click "New Alert Rule"
- Enter a name, such as "Stuck File"
- Choose the Prometheus data source that contains your OTLP metrics.
- For example,
grafanacloud-username-prom
- For example,
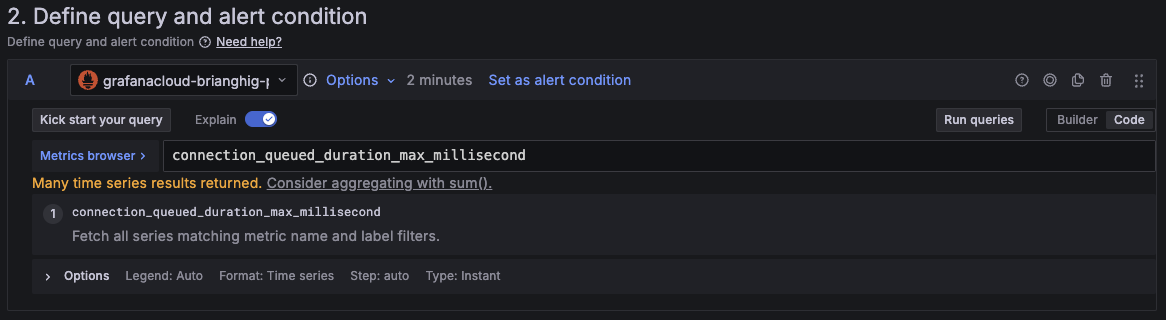
- Enter the query
connection_queued_duration_max_millisecond
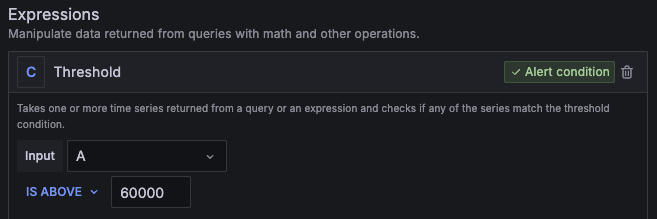
- Set the Threshold expression to
Input A IS ABOVE 60000
- In the
Set Evaluation Behaviorsection, create a new evaluation group namedAll Connections - Further down in the
Configure labels and notificationssection, you can opt to receive an email whenever this alert fires. - Once you're satisfied with the setup, click the
Save rule and exitbutton in the top-right. - Back on the
Alert Rulespage, you'll now see a preview of any pending alerts from connections with FlowFiles that have been queued for more than 1 minute.